It is easier and more precise than ever to deliver Device Boundary prediction for the purpose of 4G/5G device coordination and registration.
HTZ communications has existing capabilities to predict device boundary complying with criteria such as:
The analysis starts from the setting up technical parameters to meet regulatory criteria.
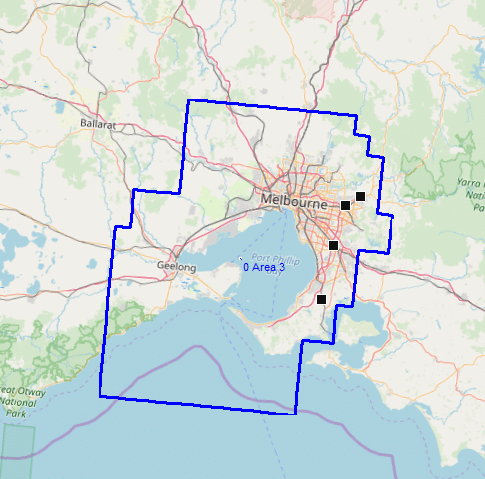
Step 1) Insert licence area boundaries (KML/SHAPEFILE) – shown in blue below:
Step 2) Model one or multiple sites at once and configure technical parameters (sites can be imported from CSV file or from SQL)
Step 3) Model beam forming massive-MIMO AAS antenna
Step 4) Setup appropriate propagation model (ITU-R P.526-14 for instance)
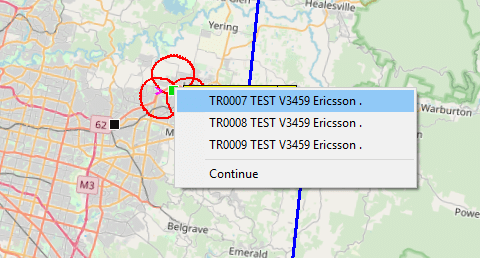
Step 5) Select sector to establish device boundary
Step 6) Select “Coordination” >> “Threshold limited polygon calculation….”
Step 7) Set up the boundary calculations as follows:
Add to vector layer: if set to “1” then the tool will calculate the device boundary in 1 degree resolution and will be added to the current vector layer attached.
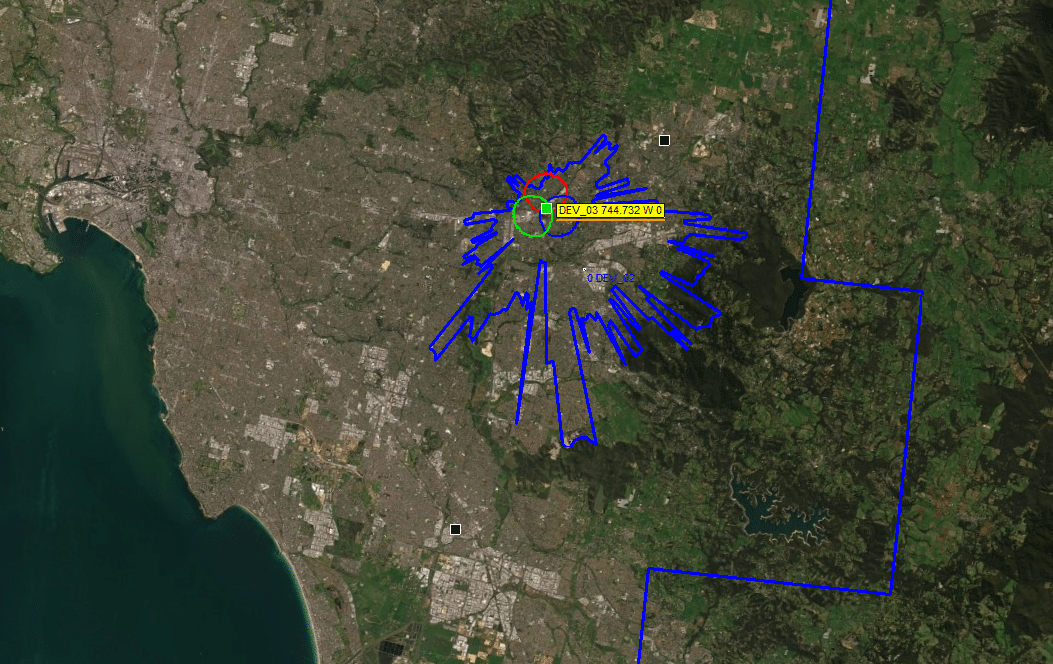
Calculation outcome for single sector:
Device boundary based on -98 dBm/MHz:
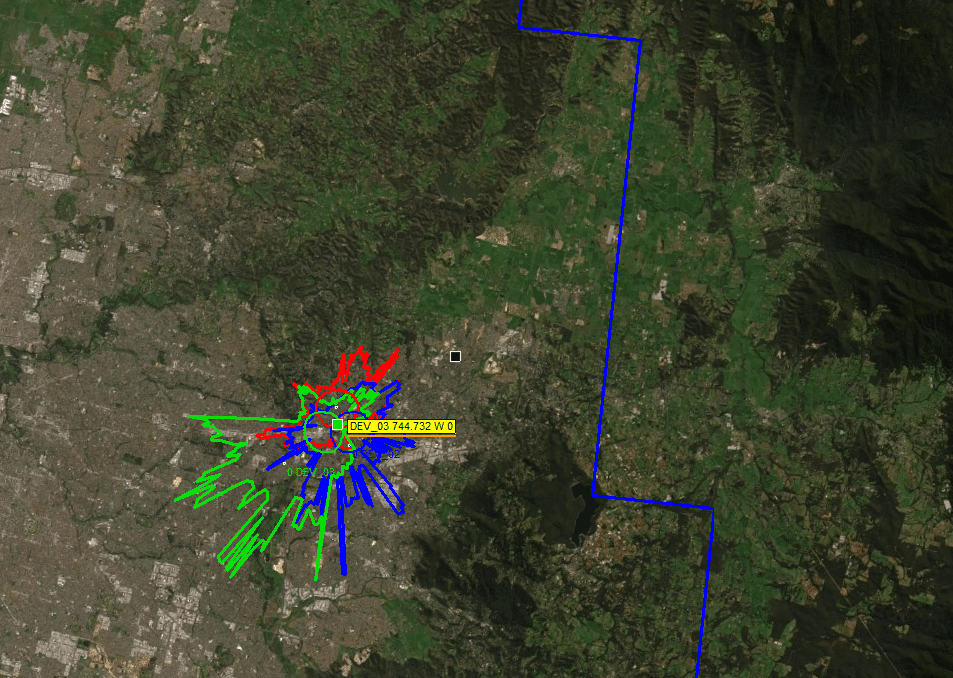
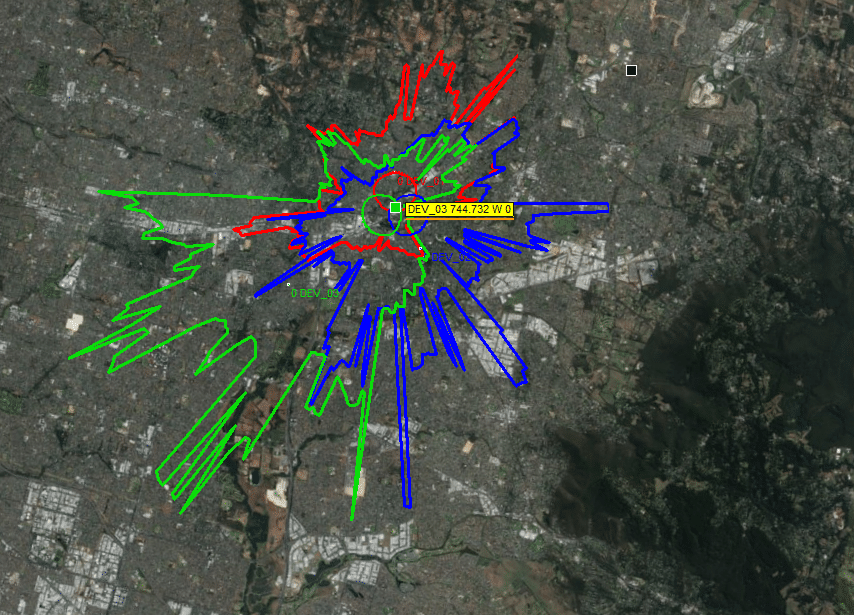
Calculation outcome for multiple sectors (different colour representing different sector). The blue lines to the North representing the licence boundary:
Analysis below presenting both the device boundary and the coverage prediction.
Light blue: Signal exceeding or equal to -98dBm/1MHz
Yellow: Signal exceeding -150 dBm but inferior to -98 dBm/1 MHz
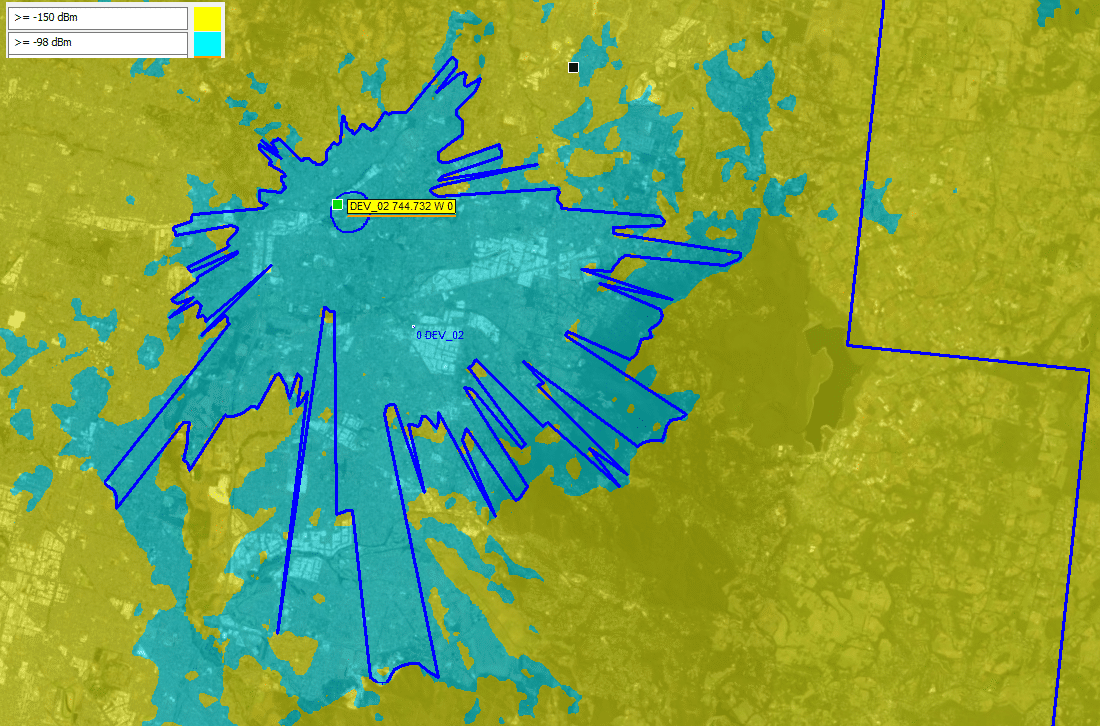
The plots above clearly show the difference between coverage (light blue plot) and the device boundary for one of the sectors (blue polygon) and the importance of the “tolerance”.